Who Could Really Vote?
This project was presented in the student illustrated paper competition (GIS/RS/Cartography group) at AAG 2014.
Zhenyang Hua, Marcos Luna | Department of Geography, Salem State University
The purpose of this project is to demonstrate the use of a cadastral-based dasymetric mapping method to map eligible voter participation at the precinct level. Voter participation can be measured in several ways: 1) the number of votes cast in a given area; 2) the number of votes cast as a proportion of registered voters in a given area; and 3) the number of votes cast as a proportion of all eligible individuals in a given area who could, in principle, vote (i.e. US citizens who are 18 years of age or older). While maps of the first two are common, the last is not. This is due in part to data availability. The numbers of votes cast in a given election and the numbers of registered voters in wards or precincts are data regularly collected and made available by state and local elections officials. By contrast, the numbers of all eligible or potential voters in a given area are often a matter of conjecture or rough estimation. These numbers must be derived by re-aggregating Census populations to voting precincts. However, Census units often do not coincide with precinct boundaries. Traditional methods of map re-aggregation, such as centroid allocation or simple areal weighting, only work well when the census units are evenly spread out, which may not always be the case. In this project we apply a cadastral-based Dasymetric mapping method to estimate eligible voter participation in precincts in Boston, Massachusetts.

Eligible Voter Population
click to see different election participation
2013 Municipal Election
2012 State Election
2011 Municipal Election
2010 State Election
2009 Municipal Election
2008 State Election
2007 Municipal Election
2006 State Election
2005 Municipal Election
Background
Non-coincident Boundaries, City of Boston
The non-coincident boundaries of precinct and tract data make data re-aggregated by centroid allocation or simple areal weighting insufficient for high accuracy population estimation purposes. In this project, to portray the eligible voter participation trend from 2005 to 2012 as accurately as possible, a special dasymetric mapping method is used to overcome this boundary issue.
Tract to Precinct
Tract to Precinct Equation
The potential eligible population consists of people who are 18 years and over, native or foreign born or naturalized U.S. citizens. In order to estimate that population more accurately, parcel property data are used to disaggregate the tract population. In order to generate population estimates of voting precincts, Census Tract population data is first disaggregated to property parcels based on the proportion of living area that each parcel represents within that Census Tract. Each parcel contains information about the amount of living area within the residential units on that parcel. The Census Tract population is allocated to each parcel based on its respective proportion of living area. The parcel level population numbers are then reaggregated to the precinct level.
Validation
Validation
Tract -- 419,681
Precinct -- 418,699

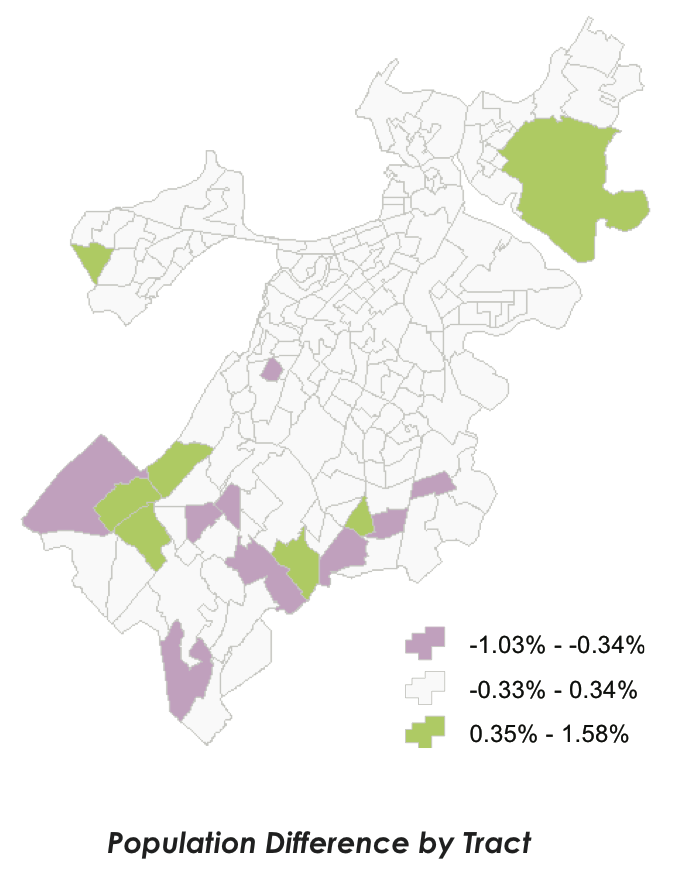
The difference between tract and precinct population is 0.23%, which is caused when we apply the proxy to the tract population by rounding up the decimal points in population data.
Potential Eligible Voter Participation, 2005-2012, City of Boston
The re-aggregated eligible voter population data was then used to recalculate voter participation in actual elections between 2005 and 2012. Voter participation in these elections was calculated by dividing the number of ballots cast by the re-aggregated eligible voter population.
Participation trends under two different presidents
A negative relationship between participation and
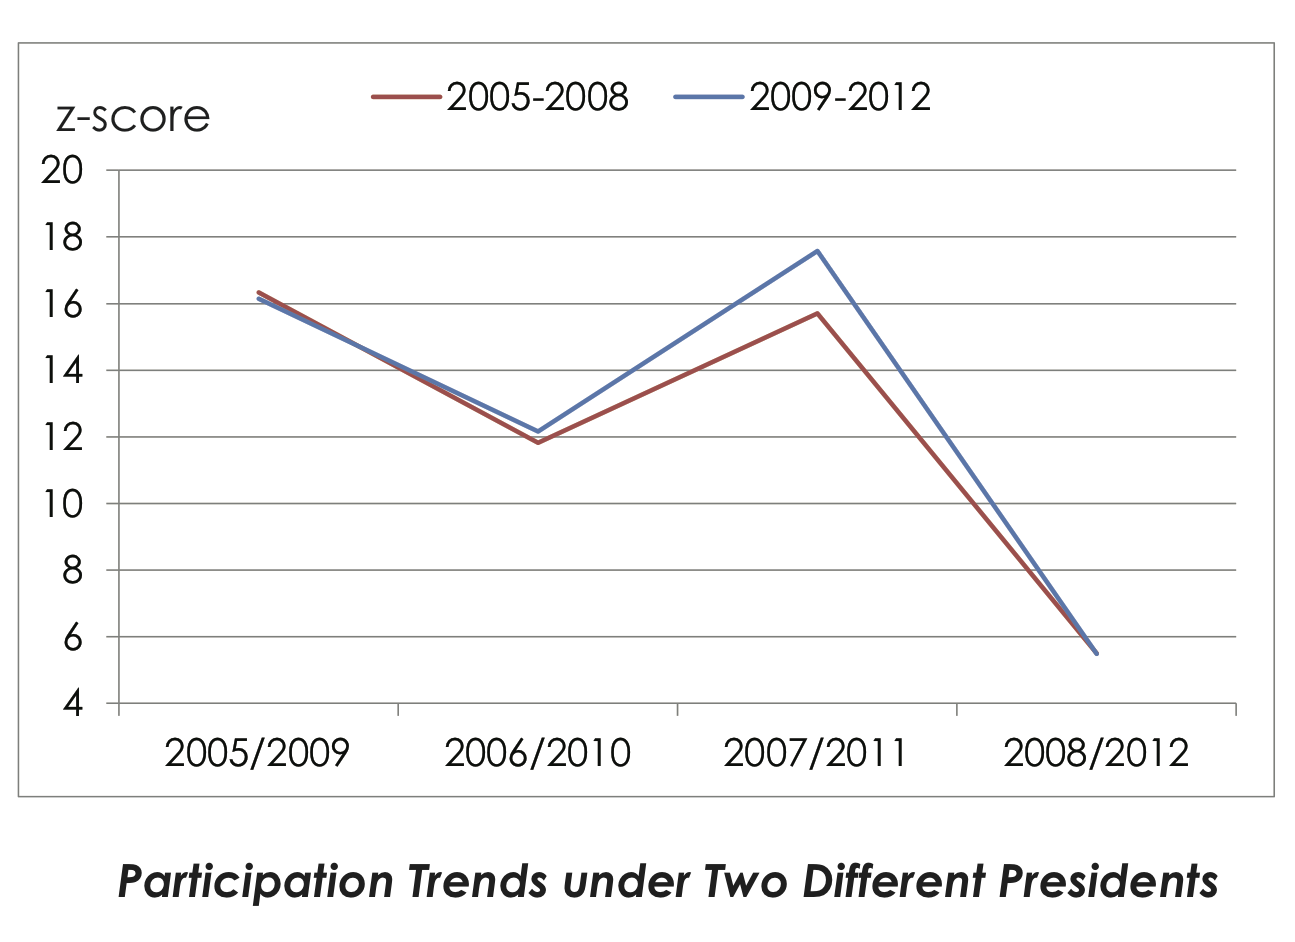
the difference in participation between precincts
One spatial trend that was revealed was that as overall eligible voter participation increased in the city, the differences in participation between precincts decreased (see line chart). In the 2007 and 2011 elections, participation overall reached their lowest points, while the overall differences in participation between precincts were at their most extreme. This pattern held true across all types of elections - municipal, state and federal - and across both Republican and Democratic federal administrations.
4-year cycle
Participation rates across time have followed a remarkably similar pattern, regardless of which political party was in power at the federal level. Voter participation rates are highest for all races during a presidential election, and this is also when differences in voter participation between precincts are at their lowest. The year after a presidential election, during a municipal election, overall participation drops to around 25%, revealing significant differences in participation between voting precincts across the city. The following year, during a state or midterm congressional election, participation rises toward 40%, with a concomitant decrease in differences in participation between precincts. Finally, with the return of another presidential election, voter participation reaches a peak of over 50%, and differences amongst precincts are minimal.
*Over 100% participation is inevitable because the ACS 2011 data only represents 5% sample data over 5 years, and the estimated population must be different than the true population.

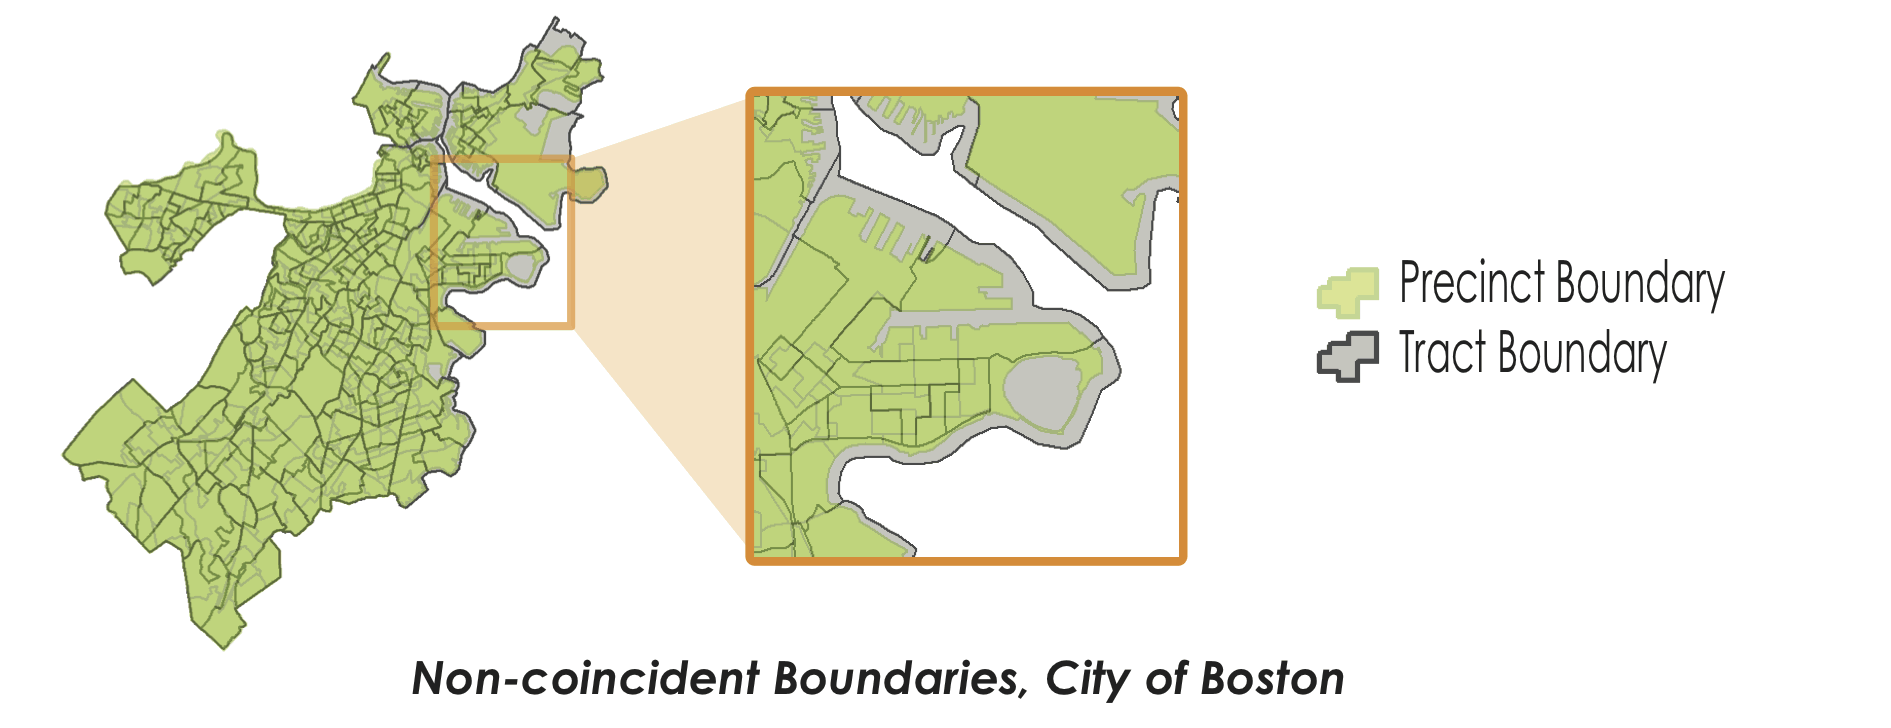
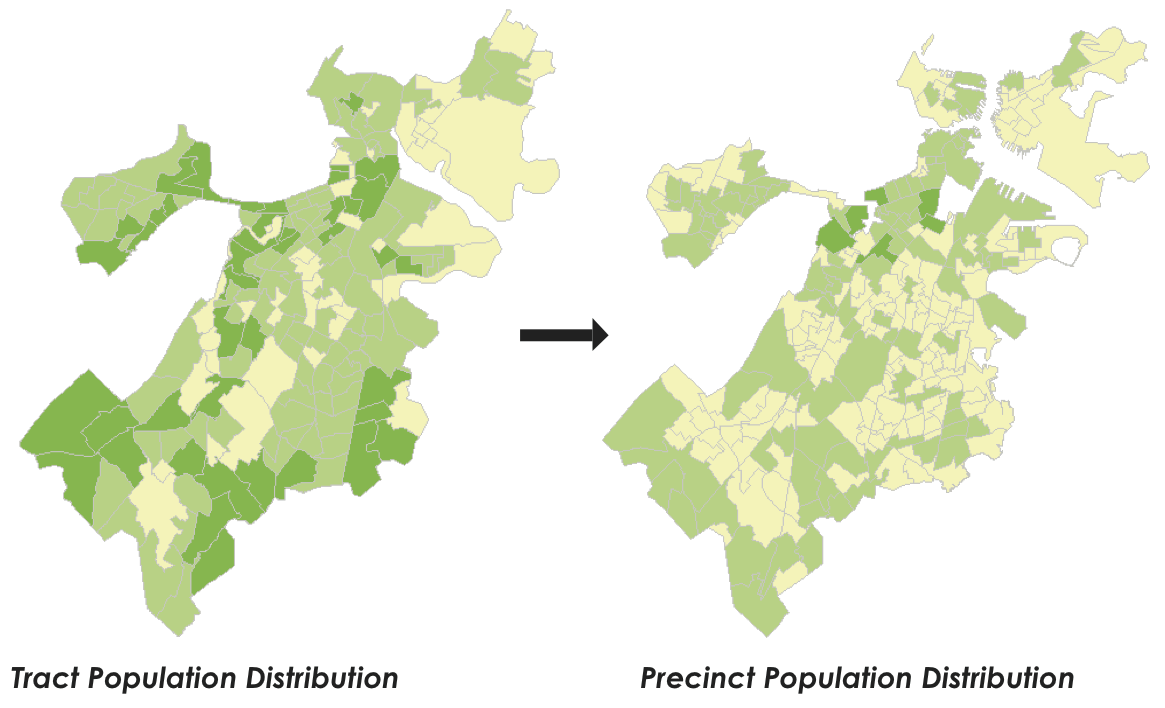
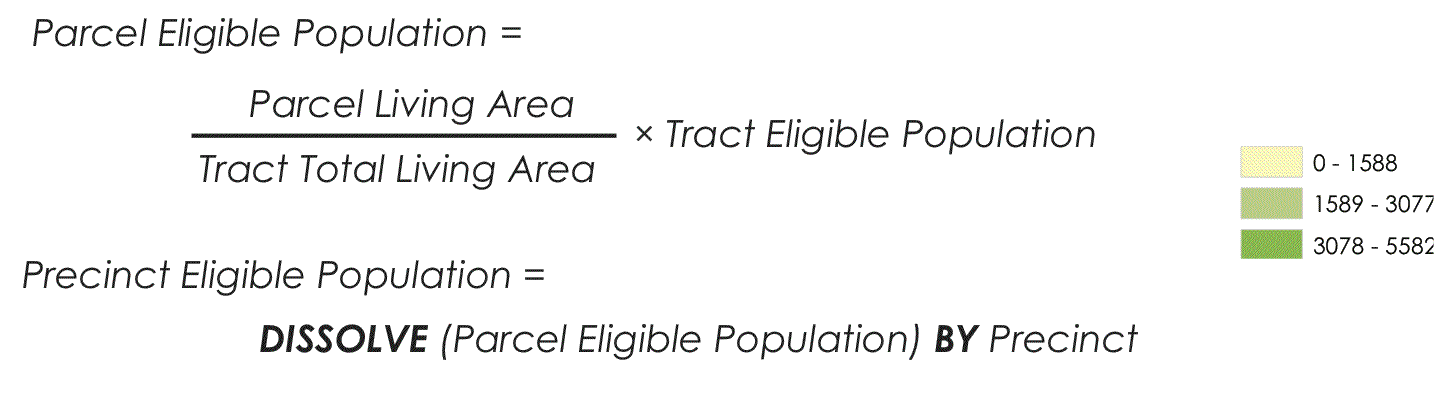
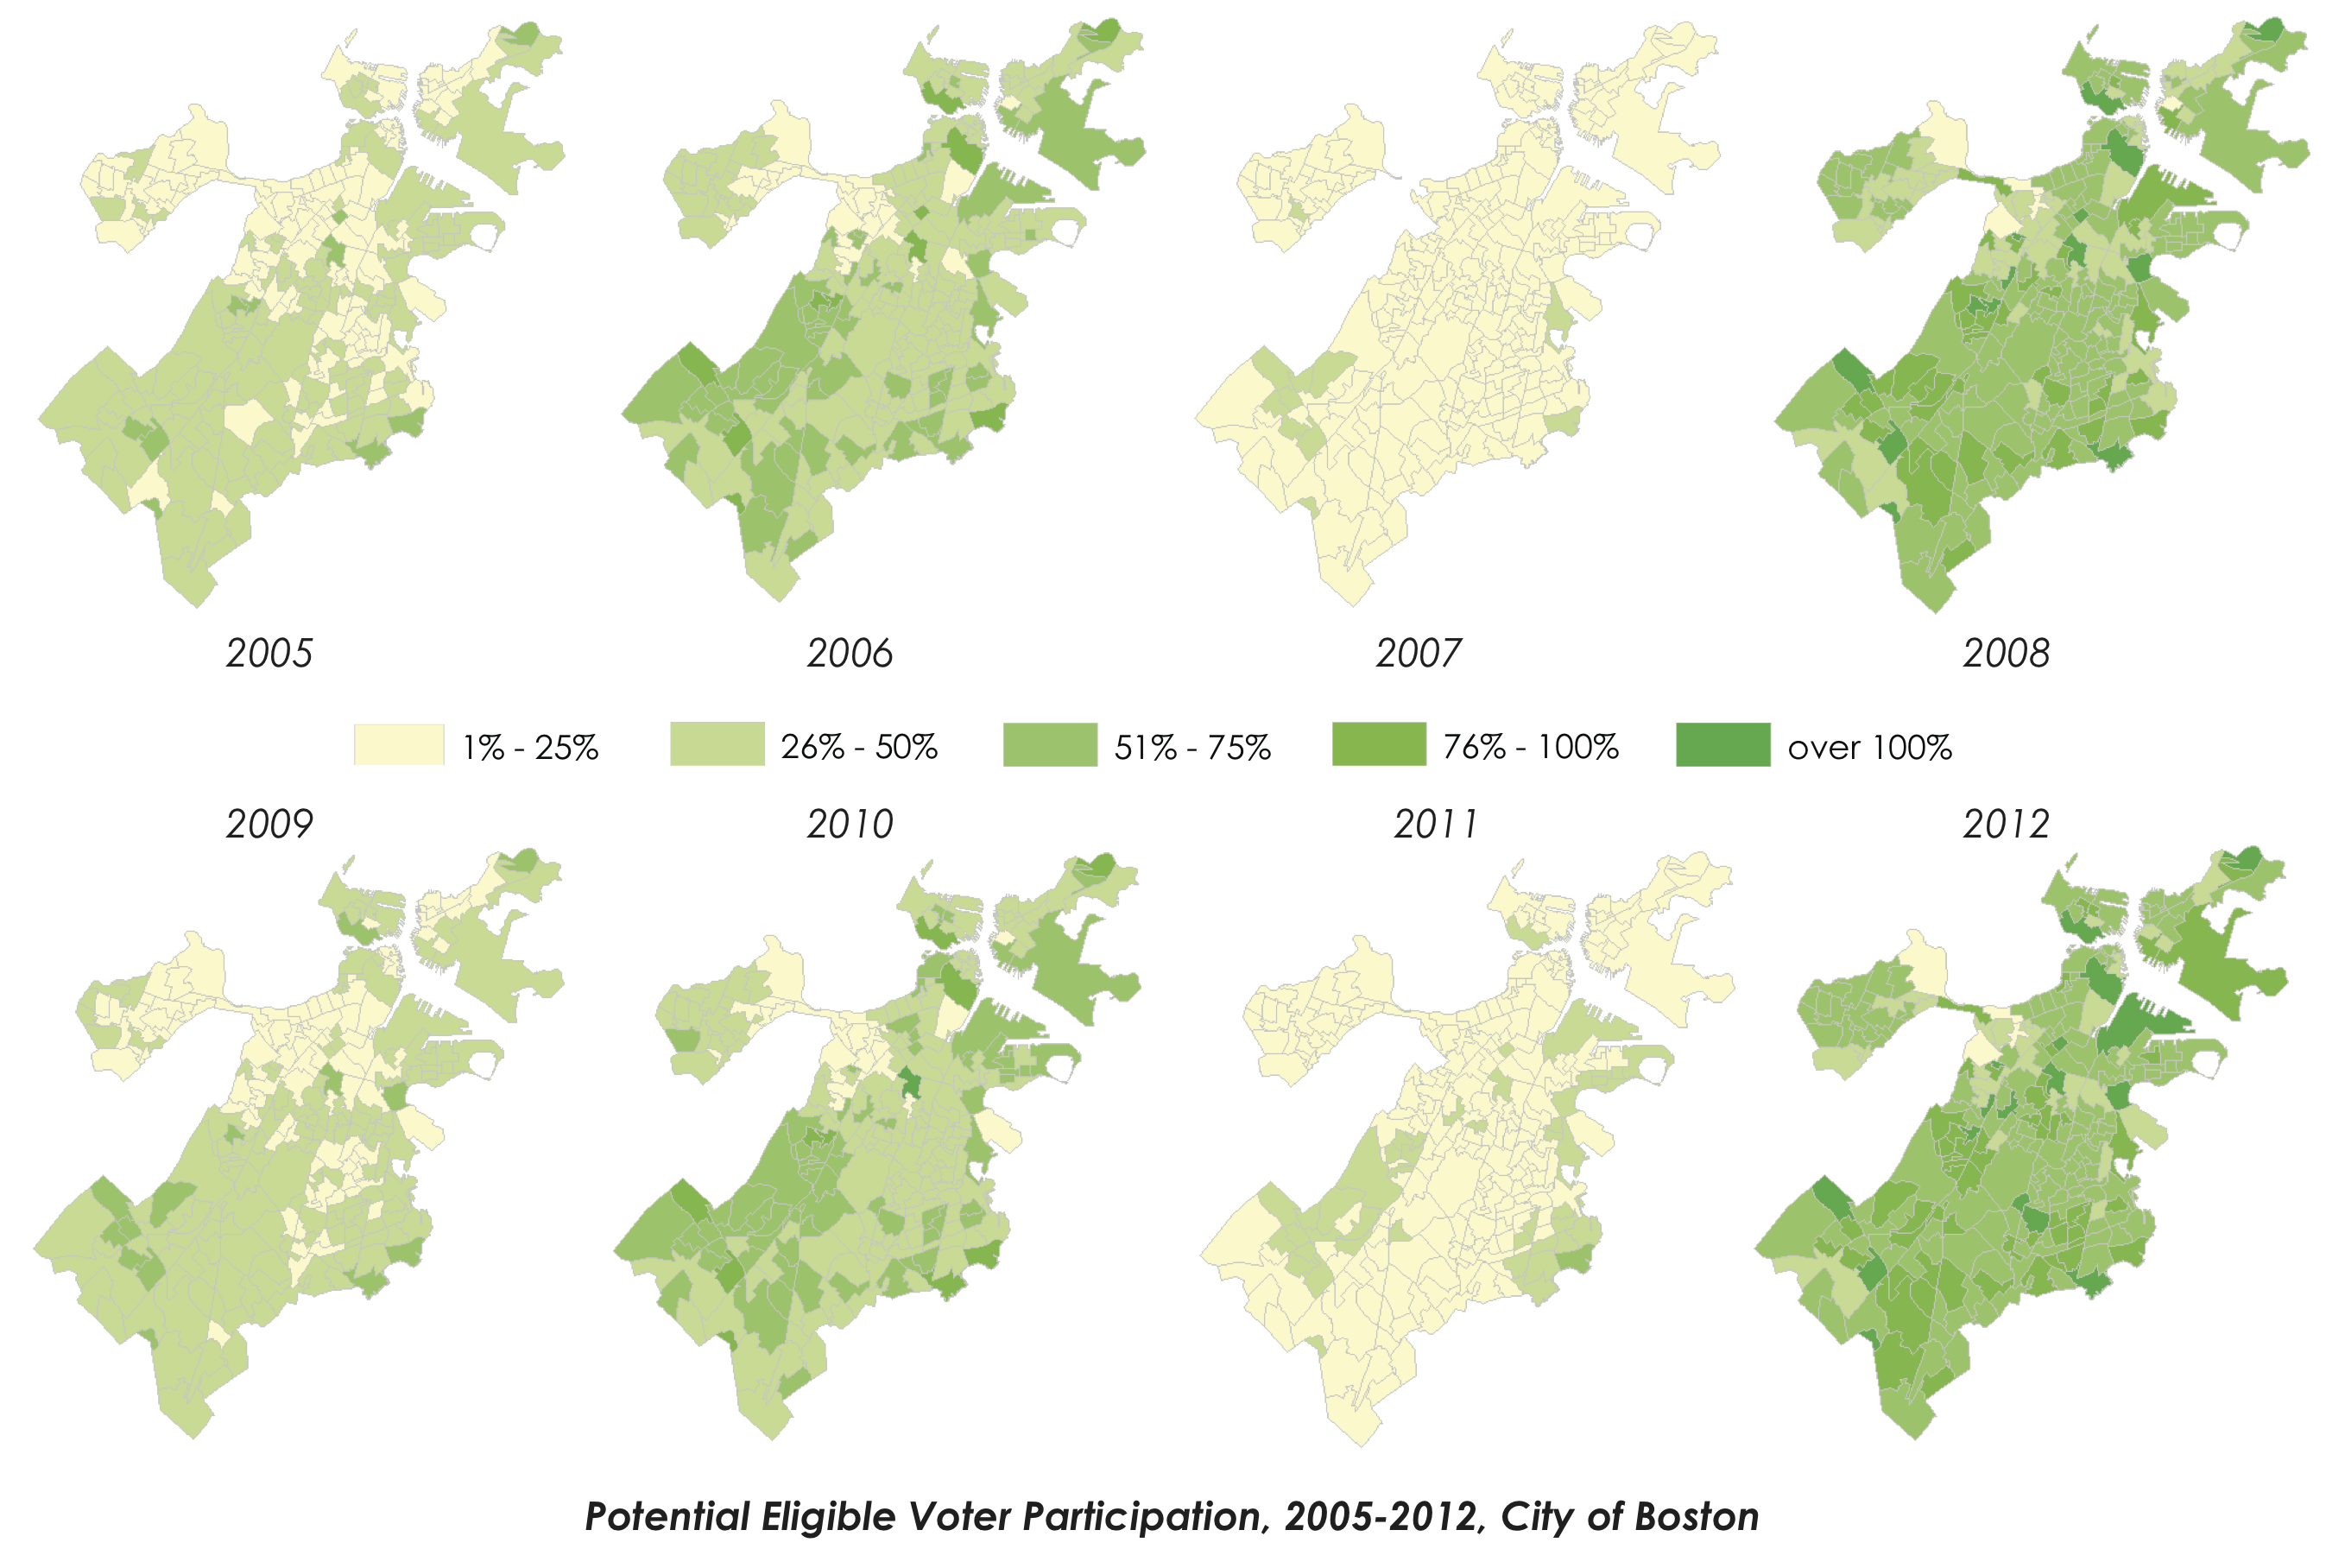
A cadastral-based dasymetric mapping method is demonstrated to estimate the potential eligible voter participation at the precinct level in the City of Boston. Parcel property polygons, which provide information on available living area for residential buildings, are used as the medium for disaggregation of American Community Survey data and reaggregation to the voting precinct level. Validation measures show that this process produces low overall rates of error. Differences between the re-aggregated data and original Census data are approximately 0.23% and the pattern of errors or differences is random, showing no spatial bias. An analysis of re-aggregated eligible voter participation in Boston precincts for the period 2005 to 2012 shows a recurring cycle in overall citywide participation and in the relative differences in eligible voter participation between precincts.

This method can also be used to re-aggregate population to almost any kind of boundary to support different sections’ requirement to population precision, such as flood zone population for insurance companies. The result of this research can also be used for supporting election campaigns to allocate their campaign resources to the highest voter participation districts.

Contact
Zhenyang Hua | edison.hua@gmail.com
Marcos Luna | mluna@salemstate.edu