Dangers of Volcanic Ash
Travel Safety Threat
Damage in Flight
Damage on the Ground
North Pacific Air
Travel
Ring of Fire
Volcano Ground Observatory
Aircraft/Pilot Limitations
Remote Sensing Detection
GOES-Visible/Thermal IR
NOAA-AVHRR
EOS AURA -MLS/TES/OMI
Monitoring
and Warning
ICAO
WMO/NOAA
VAAC
ATC
Air Carrier Operation
Flight Crew Advisories
METAR
PIREPS
SIGMETS
References
Home
|
|
Isolated locations of many volcanoes
around the world demonstrate the important role and need that global satellite
remote sensing techniques play in terms of maintaining a high-level of
aviation safety. The synoptic perspective and r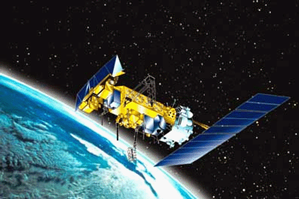 epetitive coverage afforded
by these satellites provides time series data sets (temporal response
patterns) necessary for the detection and recognition of changes in
volcanic activity levels in otherwise inaccessible areas of the world. Unique sensor types aboard earth orbiting
satellites that travel in either a geosynchronous or a polar sun-synchronous
orbit, have the ability to accurately monitor this environmental
hazard that volcanic activity presents to commercial transport aviation. They do so by
observing changes in terms of thermal activity, in terms of development and movement of ash
clouds and in terms of SO2 gas emissions as these plumes drift thousands of miles away
from an eruption site to various heights and various directions of the
atmosphere which could pose a significant threat to oncoming commercial air
traffic. epetitive coverage afforded
by these satellites provides time series data sets (temporal response
patterns) necessary for the detection and recognition of changes in
volcanic activity levels in otherwise inaccessible areas of the world. Unique sensor types aboard earth orbiting
satellites that travel in either a geosynchronous or a polar sun-synchronous
orbit, have the ability to accurately monitor this environmental
hazard that volcanic activity presents to commercial transport aviation. They do so by
observing changes in terms of thermal activity, in terms of development and movement of ash
clouds and in terms of SO2 gas emissions as these plumes drift thousands of miles away
from an eruption site to various heights and various directions of the
atmosphere which could pose a significant threat to oncoming commercial air
traffic.
GOES
Geostationary Operational Environmental
Satellites (GOES) beginning with the GOES 8 in 1994 have provided an
excellent platform for tracking hazardous volcanic ash clouds. Visible and
thermal infrared
detectors aboard these satellites are considered to be by far the most
useful volcanic cloud detec tors
for two reasons: 1) they detect volcanic ash directly and 2) GOES gives
nearly global coverage very frequently (about every 15-60 minutes). It has
been acknowledged at the 10th Conference on Aviation, Range, and Aerospace
Meteorology that the results of an impact study show "that there will most
likely be some degradation of ash detection capability, especially at
night, but that analysts armed with animated imagery will still be able to
identify and track ash clouds, and issue timely advisories for aircraft
avoidance". (above: GOES 10 composite image showing lower left to
upper
right track of Cleveland volcano ash plume ) tors
for two reasons: 1) they detect volcanic ash directly and 2) GOES gives
nearly global coverage very frequently (about every 15-60 minutes). It has
been acknowledged at the 10th Conference on Aviation, Range, and Aerospace
Meteorology that the results of an impact study show "that there will most
likely be some degradation of ash detection capability, especially at
night, but that analysts armed with animated imagery will still be able to
identify and track ash clouds, and issue timely advisories for aircraft
avoidance". (above: GOES 10 composite image showing lower left to
upper
right track of Cleveland volcano ash plume )
NOAA AVHRR
Another means of detection is the Advanced Very High
Resolution Radiometer (AVHRR)
sensor
onboard polar-orbiting NOAA satellites which can distinguish between
volcanic clouds and meteorological ones using two-band
data in the thermal infrared . According to the Alaska Volcano
Observatory (AVO), this NOAA-14 AVHRR Band 3 image below was received at 1451 UT (0651 AKDT),
and features a thermal anomaly extending 9-10 km northwest from the summit
area of Pavlof Volcano on September 23, 1996. AVO reports that the hot spot corresponds
 with eyewitness accounts of glowing flows on the northwest flank of the
volcano on the same day. They also note that the colors represent radiometric temperature; red
is hot, blue is cold and that several of the hot pixels were saturated at about 48
degrees C. In addition, adjacent to the hot pixels are three anomalously cold pixels,
called sensor recovery pixels. These are caused by the sensor being
overwhelmed with radiation from what has been termed the upscan heat source
and that the presence of
these in the image indicates the presence of incandescent lava at the
surface. with eyewitness accounts of glowing flows on the northwest flank of the
volcano on the same day. They also note that the colors represent radiometric temperature; red
is hot, blue is cold and that several of the hot pixels were saturated at about 48
degrees C. In addition, adjacent to the hot pixels are three anomalously cold pixels,
called sensor recovery pixels. These are caused by the sensor being
overwhelmed with radiation from what has been termed the upscan heat source
and that the presence of
these in the image indicates the presence of incandescent lava at the
surface.
Clearly, the data received by both the GOES and the NOAA
satellites are very useful in tracking volcanic ash plume direction
because they both provide a very large area of coverage. Yet, a major
drawback to both of these systems is that this detection begins after the
eruption has occurred; they are lacking in fine resolution abilities to
measure volcanoes in their pre-eruption stages (pixels 1000-1100m)
according to a website publication titled
An Exploration of the Use of
Satellite Remote Sensing to Predict Extrusive Events on Colima Volcano
(link to read more about this in depth study by Bruce Wahle). One way to
offset this deficiency was discovered with the use of the Total Ozone Mapping
Spectrometer. In the UV spectrum, (TOMS)
detected SO2 gas and collects volcanic cloud position data
approximately once each day during daylight hours.
TOMS
According to a USGS publication dated Jan.30,2001, "the
first TOMS sensors aboard the Nimbus-7 and Meteor-3 satellites detected 55
out of 350 known eruptions between 1979 and 1992, and also from several
eruptions not known from ground studies". However, USGS acknowledged
there was still a problem in that early TOMS instruments could only measure SO2 gas from moderate to
large eruptions that spread clouds over enormous areas. Addressing these
deficiencies they also note
that improved TOMS instruments on a later ADEOS satellite launched in 1997 and
placed in lower orbits were now able to detect gases from smaller eruptions and from
the passive degassing of some volcanoes. (The interesting feature of the
above right image is the side by side contrast of the same volcanic
eruption taken by AVHRR and that taken by TOMS.) However ADEOS failed shortly
after launch. Replacing TOMS will be a new sun synchronous polar orbiting
satellite known as EOS AURA,
scheduled for launch in June of this year; it will have many functions and
one of them will be to monitor SO2
gases with onboard sensors known as TES ,MLS, and OMI. (sensor details
found in EOS AURA link) problem in that early TOMS instruments could only measure SO2 gas from moderate to
large eruptions that spread clouds over enormous areas. Addressing these
deficiencies they also note
that improved TOMS instruments on a later ADEOS satellite launched in 1997 and
placed in lower orbits were now able to detect gases from smaller eruptions and from
the passive degassing of some volcanoes. (The interesting feature of the
above right image is the side by side contrast of the same volcanic
eruption taken by AVHRR and that taken by TOMS.) However ADEOS failed shortly
after launch. Replacing TOMS will be a new sun synchronous polar orbiting
satellite known as EOS AURA,
scheduled for launch in June of this year; it will have many functions and
one of them will be to monitor SO2
gases with onboard sensors known as TES ,MLS, and OMI. (sensor details
found in EOS AURA link) |
