Abstract
Dr. Shashikant Tripathi, Sandeep Kr Soni, Abhisek Kr Maurya, Pradeep Kr Soni
Remote Sensing & GIS Lab, MGCGV, Chitrakoot, Satna, Madhya Pradesh, India
Global warming is becoming a huge problem for the society due to carbon emission in the wake of modernisation and urbanisation. Forests, soils, oceans and atmosphere are agents for storage of carbon. They act as source or sink at different times and release more carbon than they absorb. The process by which carbon sinks remove carbon dioxide (CO2) from the atmosphere is known as carbon sequestration.
At a large scale, forests offer better carbon sequestration but at a small scale, crops have their own place. Carbon sequestration occurs in green plants through photosynthesis, using atmospheric carbon as CO2. Satellite data can be used to estimate ground biomass, seasonal productivity and carbon sequestration. Remote sensing technology can be carried out at a global scale to observe vegetation and carbon cycle. This study is characterised by large scale healthy vegetation pattern and agricultural land, biomass, open and closed shrubs. This study provides a methodology to access the biomass and carbon sequestration value with quick turnaround time. The significant value of carbon sequestration indicates that the agricultural crops can also contribute as micro-sinks and cannot be ignored while modelling carbon balance in a region.
Introduction
Carbon emission, through different sources, is a casual factor for global warming, which is the most dreaded problem across the world. Over the past century, human activities like burning of fossil fuels, deforestation and urbanisation have resulted in high concentration of CO2 and other greenhouse gases in the atmosphere(USGS, 2002). CO2 is one of the most common greenhouse gases resulting global warming which in turn brings about rise in sea level, draught, deforestation, etc. Forests, soils, oceans and atmosphere are agents for storage of carbon. They act as source or sink at different times and release more carbon than they absorb. In these agents, sinks absorb more carbon than they emit. This is measured in-situ after calculation of the biomass of dried plant species. This method gives very good results, but is both labour and cost intensive. Remotely sensed satellite data is a technology to calculate the biomass and ultimately carbon sequestration value of plants in a larger area in quick turnaround time and is cost effective. In the present study, carbon sequestration value of wheat crop has been calculated for the rabi season 2006-07.
Carbon sequestration is a phenomenon for the storage of CO2 or other forms of carbon to mitigate global warming. Through biological, chemical or physical processes, CO2 is captured from the atmosphere. CO2is a type of greenhouse gas. Carbon sequestration is a way to mitigate the accumulation of greenhouse gases in the atmosphere released by the burning of fossil fuels and other anthropogenic activities. A carbon sink may be defined as reservoir that collects and stores carbon containing chemical compound. Carbon sinks remove CO2 from the atmosphere through absorption. Forests, soil, oceans, plants and algae are natural sinks. There should be a precise, accurate and cost effective method for measuring the quantity of carbon sequestration. Therefore, we can use conventional method as remote sensing and GIS, which may offer a better alternative in this regard. According to Seller et al, 1995 and Bastiannssen at al, 1998 report, using remote sensing, some methods in biomass/carbon estimation in plants have been developed but very little validation of the land surface prognostic or diagnostic variables have generally been attempted.
Billons of tonnes of CO2 is locked as organic matter around the planet. Due to natural processes, this organic matter is converted into fuels such as petrol, diesel, coal, wood and peat. This stored carbon dioxide is released into the atmosphere when the fuel is burnt. Carbon dioxide gets locked away again naturally but not as fast as it is currently being released. Sinks soak up the emitted gas and store it for a longer period of time. Lithosphere, ocean, soil, atmosphere, biosphere and biomass works as sink for carbon storage.
There are many conventional methods for quantification of sequestered carbon. Many of these methods are complicated, expensive and limited in their coverage. Such limitations impede sound quantification and monitoring of carbon. Remote sensing can provide answers against such measurement and monitoring limitations. The remote sensing approach can meet the requirements of carbon sequestration such as permanent sample plots (MacDicken, 1997) achieved by means of fixed coordinates, coupled with the systematic repetitive characteristic of most satellites. Tucker (1979), Richardson et al (1983), and Christensen and Goudriaan (1993) demonstrated that the reflection of the red, green and near-infrared (NIR)radiation contains considerable information about plant biomass.
The main objective of this study is the calculation of carbon sequestration value of wheat crop in different districts of Punjab, India during Rabi season of 2006-2007. The study area is the entire state of Punjab. Wheat is a popular crop grown in almost entire Punjab. It is located from latitude 29032’ to 32032’N and longitude 73055’ to 76050’ E. It covers an area of 50,362 sq. km. (19,445 sq. mile). Situated in north-western India, the state is bounded on the north by Jammu and Kashmir state and Himanchal Pradesh state, on the south and south-west by Rajasthan state and on the west by Pakistan. According to 1991 census, its population is 20.19 million. Major crops of the state are wheat, maize, rice, pulses, sugarcane and cotton. Rainfall ranges between 250mm and 1000mm. The temperature varies between a minimum of 0.20C to maximum of 460C.
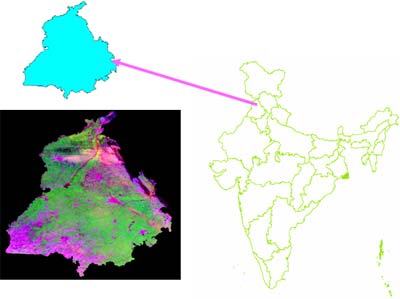
Fig: 1-Study Area
Methodology
MDOIS (moderate resolution imaging spectro-radiometer) satellite data is used for the study due to its resolution of 500m. The MODIS instrument onboard National Aeronautics and Space Administration (NASA)’s Terra satellite is a scanning radiometer system with 36 spectral bands extending from the visible to thermal infrared wavelengths (Running et al., 1994). The first seven bands are primarily designed for remote sensing of land surfaces providing spatial resolutions of 250 m for band 1 (red, 620−670 nm) and band 2(near infrared, 841−876 nm), and 500 m for bands 3 to 7 (459−479, 545−565, 1230−1250, 1628−1652, 2105−2155 nm, respectively). For this study, band 1, band 2 and band 7 of MODIS imagery were used to map areas of wheat fields. According to the farming practice in the study area, MODIS data of Feb 2007, covering the whole of Punjab Province was acquired from NASA (USA). This date corresponds with the late wheat planting season (transplant stage and mature stage). The software package used for image and geo-information analyses was ERDAS IMAGINE 8.4. Topographic maps, 1:250000 scale land maps, were used in the study.
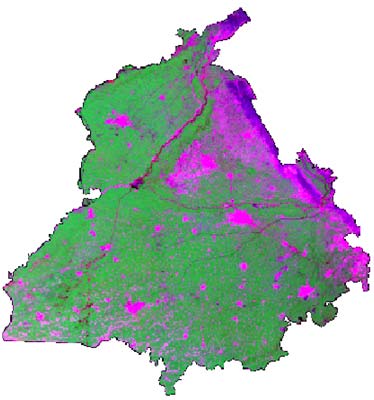
Fig: 2- MODIS Satellite Data for February Month 2007
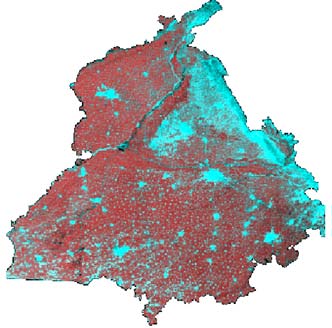
Fig: 3-MODIS Satellite Data for February Month 2007 in FCC IMAGE
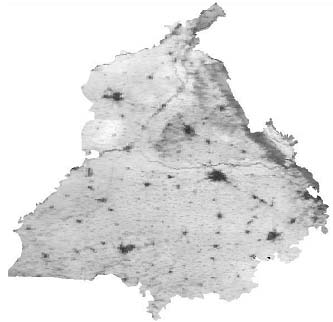
Fig: 4- MODIS Satellite Data for February Month MOD GHK09 2007
The Following Methodology Experiments of Monteith showed that the increase of plant biomass net primary production (NPP) from well drained manuring crops can be represented by Eq. (1):
where
NPP=net primary production
APAR=Absorbed Photo-synthetically Active Radiation
LUE=Light Use Efficiency factor
PAR=Photo-synthetically Active Radiation
Seller , Asrar et al. and Frouin & Pinker have shown that PAR and APAR can be derived from remote sensing data by using the normalized difference vegetation index (NDVI) which uses the wavelength in the red (RED) and infrared NIR.
NDVI=NIR-RED/NIR+RED (2.a)
APAR/PAR~NDVI (2.b)
The biomass production per time step can be expressed as in Eq. (3):
The crop acreage extraction process utilises the digital satellite data of MODIS Terra 250 meter resolution satellite images. 10 images are used for the process. Digital image processing techniques are used on the satellite data. The ERDAS Image processing software is used for enhancement and processing of satellite data. We used a topographic map (1:250000) of the area as reference for distinct Ground Control Points. We captured area of interest (AOI) from the toposheet and subset the satellite image. Subset image was then classified with unsupervised process into 85 classes. Then the image recoded into two classes viz. vegetated and non-vegetated area, using visual image interpretation and comparison with the original FCC image. The image of 1 November shows pure cultivation stage while that of 23 February shows mature stage. We performed a change detection between the mature stage image (23 February) and Pre harvesting image (1 November) to get the wheat cultivation area. In the same way also monitored the various growing stage of the wheat using multi temporal data.
Mathematical calculation for extraction of wheat area
Formula
Area (m2) =Numbers of pixels of clusters * Resolution2 of the image
Area (ha) = Area (m2) / 10000
Here we have the image of MODIS terra 250 m sensor so Area (m2) =Numbers of pixels of clusters * 250*250
Mathematical representation of the algorithms used -
A theoretical summary of the steps involved in the calculation of biomass from remote sensing data is as outlined below (Samarasingha, 2000):
NDVI = ƒ(Band 4, Band 3) Ref. (Tucker, 1979)
Biomass = ƒ(APAR) (W/m2)
Kumar and Monteith, 1981 in ( Samarasingha, 2000)
FPAR = ƒ(NDVI) (Daughtry et al., 1992)
PAR = ƒ (K↓) (W/m2)
(Christensen and Goudriaan, 1993) for clear sky and Tropical countries PAR is 0.51
Biomass = APAR*ε(g/MJ) (Field et al., 1995)
Where ε = light use efficiency
ε = ε°*T1*T2*W (g/MJ) (Potter et al., 1993; (Field et al., 1995)
Where ε° = globally uniform maximum (2.5g/MJ) and
T1 and T2 relate to plant growth regulation (acclimation) by temperature
Where T2=1.185*{1+exp (0.2Topt-10-Tmon)}-1*{1+exp
(-0.3Topt-10+Tmon)}-1 (Fielde t al., 1995)
Calculated for Training area T2=5.4267
Where, Top t = mean temperature during the month of maximum
NDVI (constant for a certain vegetation type during the season),
July for Punjab has maximum NDVI; Mean temperature for July is 20 degree Celsius and
T mon = mean monthly air temperature. Our study is for February
This has a mean Temperature of 9 degree Celsius
T1 = 0.8+0.02*Topt–0.0005*(Topt) 2 (Field et al., 1995)
Calculated for Training area T1=1
W = 0.5+ (EET/PET) (Field et al., 1995)
W = Λ, the evaporative fraction from SEBAL. (Bastiaanssen and Ali, 2001),
Where PET is potential evapotranspiration
And EET is the estimated evapotranspiration
Evaporative fraction for Punjab is 0.27
LUE=ε *T1 *T2 *Λ
Calculated for Training area LUE=3.6630225
Therefore, Biomass = NDVI*PAR*LUE Calculation of carbon for the entire scene =summation of pixel values for the entire scene. =416101.03 kg/m2
Calculation of carbon for individual pixels in kg/ha= 416101.03*1010 / 1315*1459*3467506
=625.46 kg/ha
And
Total value of carbon sequestration in wheat area = 2168786302.76 kg=2168786.30276 tonne
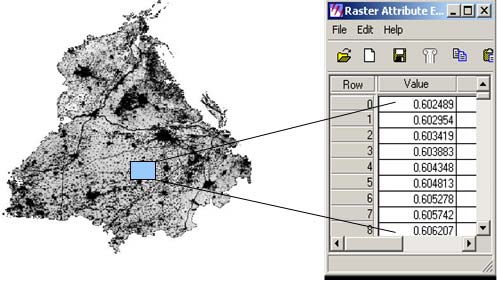
Fig: 6 Carbon pixel value calculation in this technique
Results and discussion
The wheat crop area of the Punjab State has been estimated district wise. The result is shown in fig; 7, table; 2 and bar graph (fig; 8). In the present study, we have calculated the acreage of wheat in current rabi season (2006-07) using remote sensing and GIS and compared to last year’s acreage. The estimated acreage is 3,467,506 hectares which is negligible change in the acreage of wheat compared to last year’s estimation. In the district wise acreage estimation, we find that Nawan Shahr has lowest acreage of wheat due to small district of the state and Sangrur has highest acreage of wheat. The calculated amount of carbon sequestration through remote sensing and GIS is 625.46 kg/ha. The total estimated value of carbon sequestration is 2168786.30 tonnes, calculated based on the biomass of the wheat calculated through remote sensing and GIS. The highest amount of carbon Sequestration, in the district of Sangrur, was calculated to be 248068.69 tonne. The least carbon sequestration amongst the 17 districts of Punjab was found in Nawan-Shahr. The value calculated in this small district was 44395.77 tonne.

Fig: 7- Wheat crops acreage estimation image
Table: 1-Wheat area District wise estimation using RS & GIS Technique in 2006-07
Fig: 8-Bar Chat showing Acreage of Wheat in different districts of Punjab 2006-07.
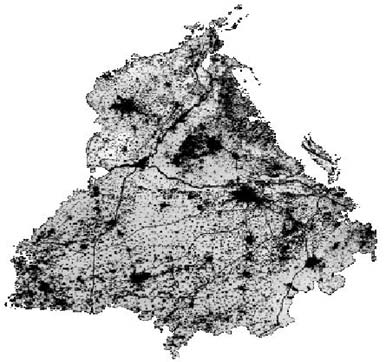
Fig: 9–Image of Carbon Sequestration in Wheat Crop
Table: 2-District wise Carbon Sequestration in Wheat Crop for 2006-07.
Conclusion
The present study provides a feasible output in the estimation of crop production, biomass and carbon from remotely sensed data. We can analyse outputs with inherent map production characteristics over a large area in one-time investment. The total amount of carbon sequestered in wheat crop is 2168786.30 tonne on an area of 3467506 hectares. However, it is clear that the amount of carbon sequestrated by the wheat cultivation areas is extremely high. This study holds great potential for further investigation. Carbon sequestrated from crop helps environment and contributes to the reduction of greenhouse gases. Thus the idea of carbon trading can be extremely lucrative. The Indian economy predominantly depends on agriculture. Agricultural land is available in great quantities as natural resource, however the potential of these lands as carbon sink during the cropping season has not been speculated or exploited to the optimum. This study, when completed, keeping all the variable and parameters into consideration, will prove to be of great scientific value. It is high time that the world and India in a particular understands that there are alternative sinks of carbon, apart form the traditional concepts of forests being a sink. Forests are fast depleting and we desparately need carbon sinks to control global warming.
Acknowledgement
The authors are thankful to remote sensing and GIS lab, MGCGV Chitrakoot for providing the lab facility and encouragement for the present study.
References
Christensen, S., and J. Goudriaan. 1993. Deriving Light Interception and Biomass from Spectral Reflection ratio. Remote Sensing Environment 48:87-95.
Daughtry, C.S.T., K.P. Gallo, S.N. Goward, S.D. Prince, and W.P. Kustas. 1992. Spectral Estimates of Absorbed Radiation and Phytomass Production in Corn and Soybean Canopies. Remote Sensing of Environment 39:141-152
Field, C.B., J.T. Randerson, and C.M. Malmstrom. 1995. Global Net Primary Production: Combining Ecology and Remote Sensing. Remote Sensing and Environment 51:74-88
Houghton, R.A. 1996. Converting Terrestrial Ecosystems from Sources to Sinks of Carbon. Ambio 25:267-272.
MacDicken, K.G. 1997. A Guide to Monitoring Carbon Storage in Forestry and Agroforestry Projects. Winrock International Institute for Agricultural Development., USA.
Richardson,J.,J.H. Everitt, and H.W. Gausman. 1983. Radiometric Estimation of Biomass and N-Content of Alicia Grass. Remote Sensing Environment. 13:179-184.
Sellers, P.J, et, al.1995. Remote Sensing of the Land Surface for Studies of Global Change: Models-Algorithms-Experiments. Remote Sensing and Environment 51:3-26.
Tucker, C.J.1979. Red and Photographic Infrared Linear Combinations for Monitoring Vegetation. Elsevier North Holland Inc. 8:127-150.
|