| AVHRR |
|
|
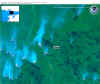
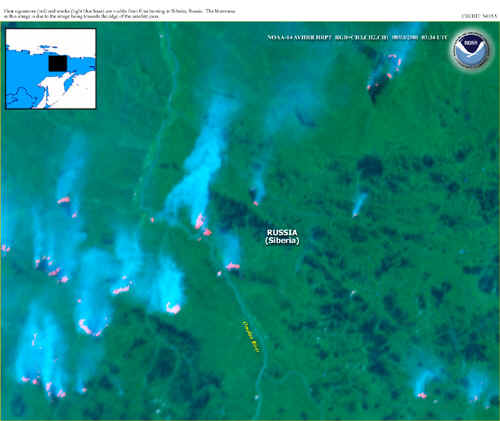
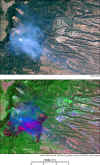
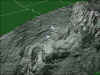
Take over Siberia, Russia, this image is created
by adding the visible band and thermal band. the visible band shows
the smoke and the burn area caused by fires. Infrared bands show the
active fire itself. 
|
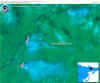 A
similar image of Kolymskya Nizmenost, southern Russia. It clearly shows the forest fires
and their burnt scar. this image was taken in different time of the
day than the previous one. |
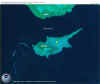
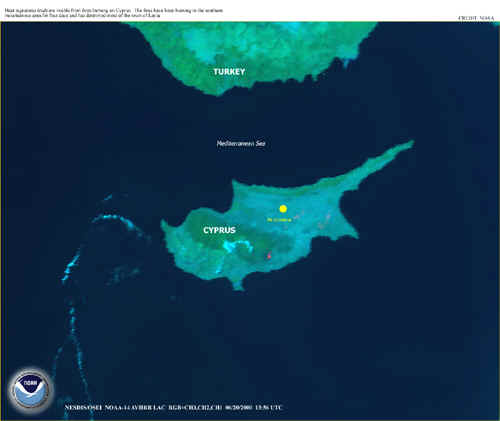
An infrared image Cyprus Island, in the Mediterranean
Sea. It shows an active fire burning in the southern part. Notice,
AVHRR's advantageous high spatial resolution.
|
|
|
ATSR
|
|
|
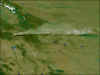
The image is a false color composite of visible
channel data. It clearly shows the plume of smoke emanating from fires in
Borneo Island, Indonesia.
|

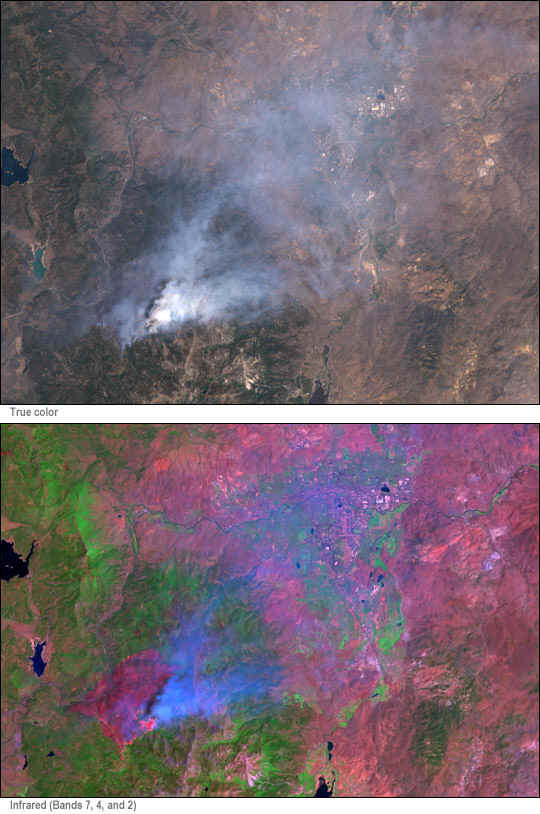
This is a color composite image of the forest fires
presently raging in the States of Idaho and Montana. In this
representation there is a clear distinction between the cloud (white)
and the smoke from the fires (blue), whilst forested areas appear
green.
|
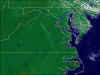
This is a night-time false color image, showing the coast of Turkey and some of the Greek
Islands. A cloud of warm smoke, due to wild fires, is clearly
visible.
|
|
| MODIS |
|
|
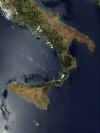
This true-color image shows several fires burning
in southern Italy, as well as a couple fires in the northwest of
Sicily.
|
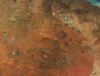
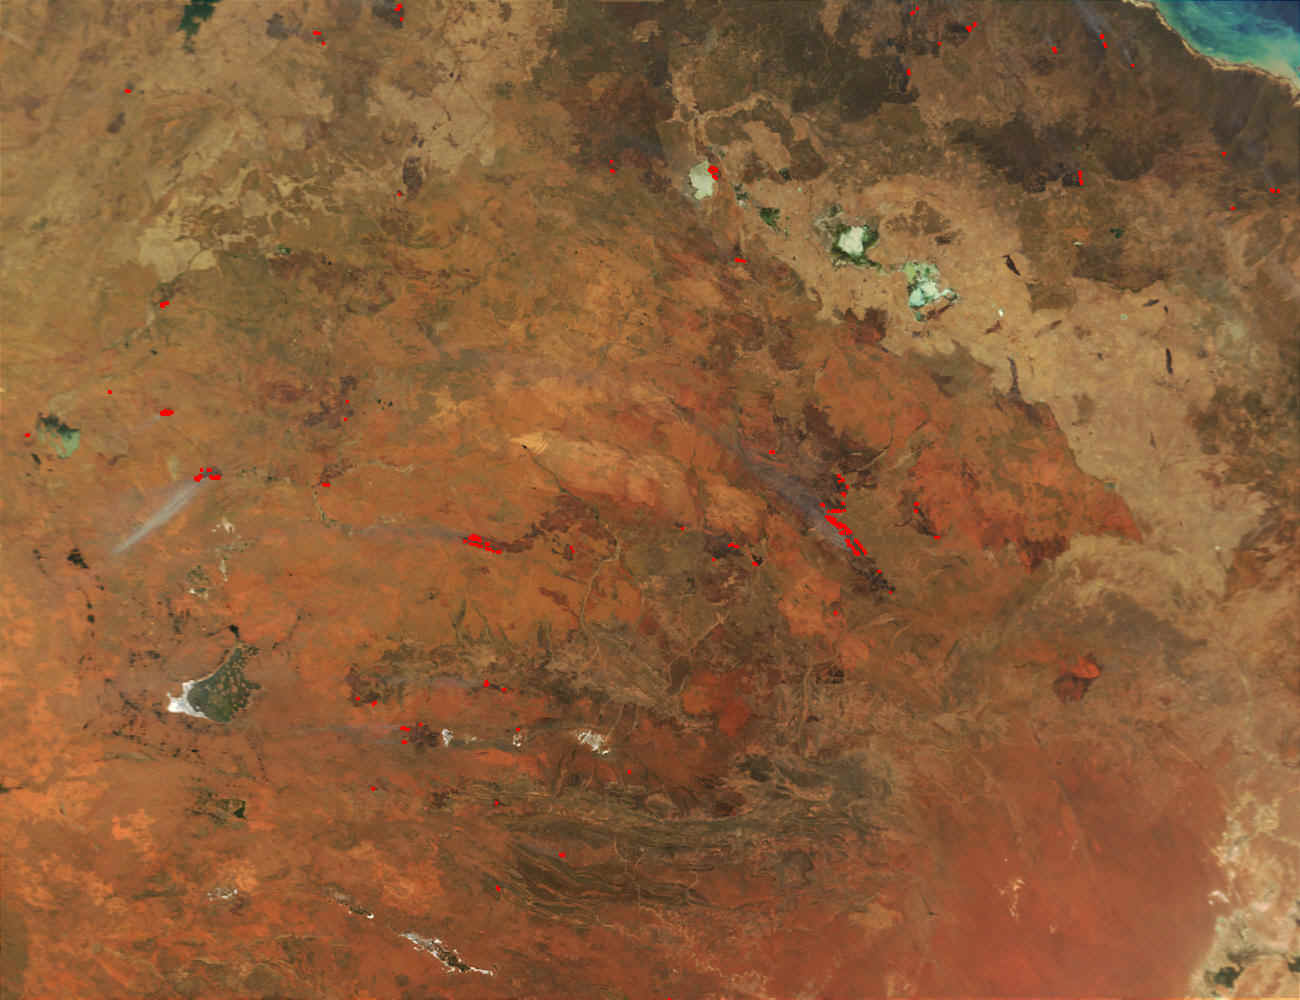
Fires are burning throughout Australia's Northern
Territory, seen here in this true-color image. |
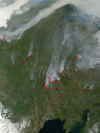
This true-color image shows the detection of
dozens of fires burning in Eastern Siberia, Russia.
Heavy smoke shrouds much of the region and stretches out over the
East Siberian Sea. |
|
| Landsat |
|
|

Two images (visible and infrared) are added
together to give a final image. The visible band is used to identify
the plums of smoke and infrared to spot the hot spot (active fires).
|
Another two images (visible and infrared) are
added to the final image of the wildfire and its scars. |

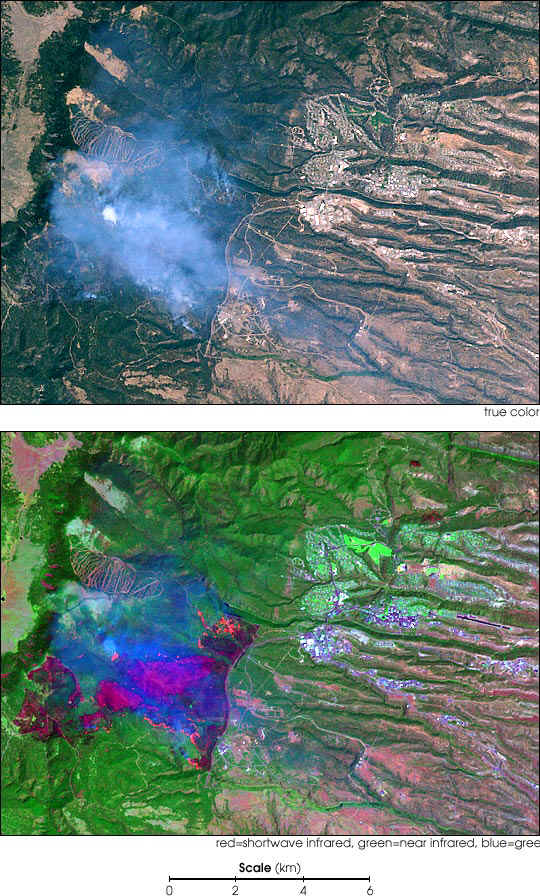
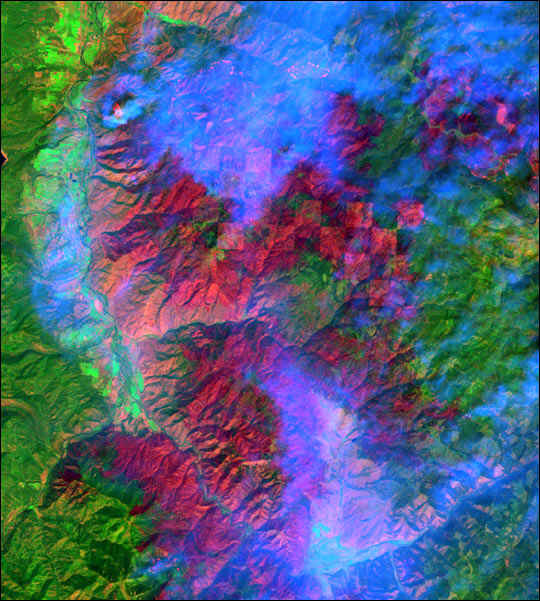
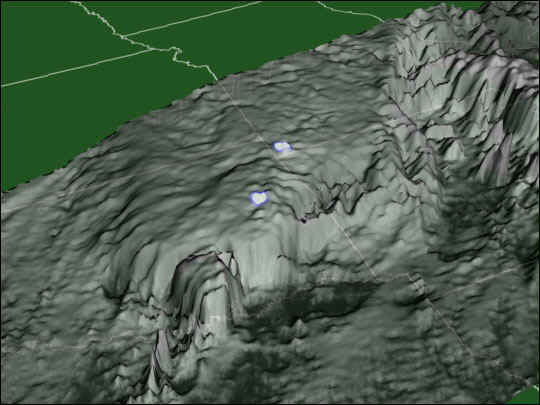
This false-color image over the Bitterroot
National Forest, Montana, was made using a combination of the
shortwave infrared, near-infrared, and blue wavelengths. |
|
|
GEOS
|
|
|
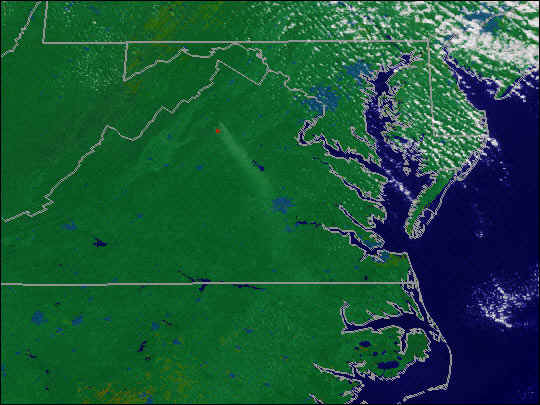
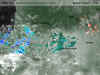
This is an image of two fires
in the Shenandoah National Park, Virginia. This animation shows
smoke from the Shenandoah fire on. The red pixels show the areas
that were actively burning.
|
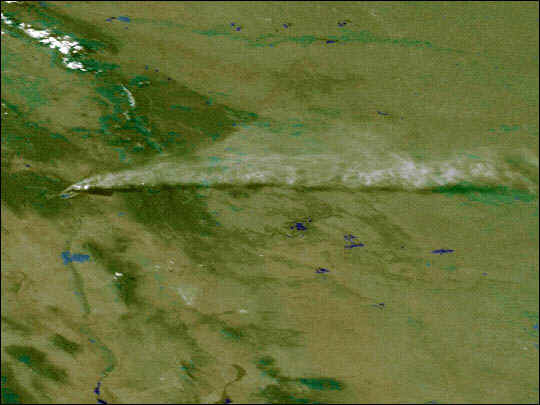
This is an oblique image of a fire spread out of
control near Los Alamos, New Mexico. You can see the wind factor and
its role in spreading fires. |
 This
is an image of huge wildfires burning in Colorado, Montana, Idaho,
Utah, Washington, Nevada, Arizona, New Mexico, Texas, and California.
Notice the tremendous area covered by the image. |
|
| TRMM |
|
|
The above is an image of the forest fires of the
Indonesian island of Borneo. It also illustrates a interesting
phenomenon. Smoke from fires prevent clouds to from rain. this done
by the Precipitation Radar on board of TRMM.
|
In this image, lightning flashes, overlaid on
high-resolution infrared cloud-top data from the orbiting. High
flash rates visible indicate the potential for forest fires caused
by lightening. This is very common in Siberia, Russia. |

This map shows man-made and natural fires for
September, 1999. Dark red indicates low numbers of fires (1-5 per
month), orange and white represent increasing numbers of fires, up
to about 100. The data is derived from the visible and infrared
bands. |