

|
Glaciers Monitoring and Early Warning System Remote Sensing Perspective |
|
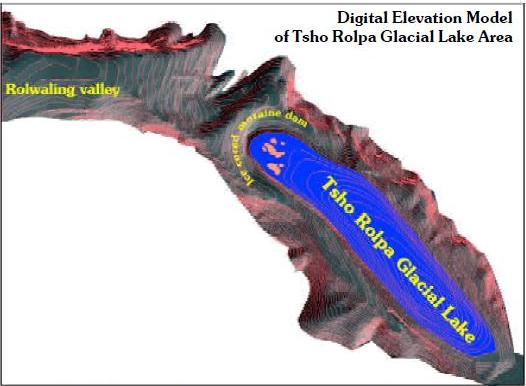
Digital Elevation Model of Tsho Rolpa Glacier Lake
|
|
Figure 14:Tsho Rolpa Glacier area DEM(Mool,1998) |
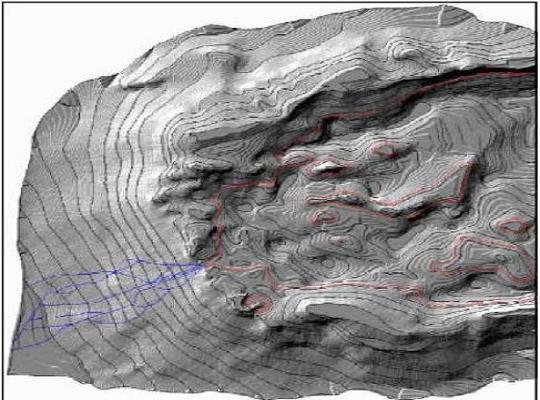
Figure15:DEM of end moraine dam of Tsho Rolpa glacier lake area. red line indicates water level (june,1994). Blue line is the overflow and outlet of the lake (modified after Modder and Olden, Mool 1998) |
|
Design by: Milan Budhathoki, MS Geo-Information Science, Salem State University, Salem, MA m_budhathoki@salemstate.edu Last updated on 22nd November,2010 |
|
Case study– Tsho Rolpa |