Satellite Remote Sensing Applications for Commercial and Recreational Fishing
 Introduction
This website looks at the ways the
commercial and recreational
fishing industries
are able to take advantage of data
retrieved from satellites to help improve
their catch yield and overall
operational efficiency.
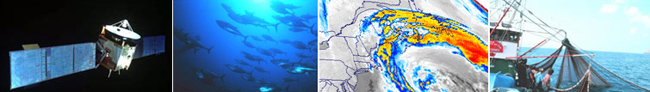
With the emergence of satellite remote sensing, commercial and recreational fishing operations have grown in sophistication in recent years. Remote sensing satellites produce a wide range of oceanographic, biological, and environmental data that has become very useful to the offshore fisherman. I have broken the functional uses of satellite remote sensing data for fisherman down into 5 major categories:
Of course it is not just the fisherman who have applicable uses for this data, fisheries management agencies and scientists also use ocean-observing satellites in order to monitor catch quotas for long term sustainability of the fishery resources and the protection of marine biodiversity.
Remote Sensing data from satellites will continue to improve the underlying economics for fishermen by helping them increase the ratio of fish caught to time spent on the water. Remote sensing satellites will also provide fisheries managers with a better understanding of the close relationship between fish populations and the marine environment.
![]()
 Sea Surface
Temperature
Sea Surface
Temperature
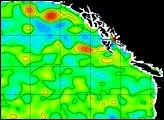
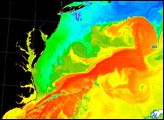
One
of the most useful data sets for fisherman offered by ocean remote sensing is
sea surface temperature (SST). Infrared
sensors on environmental satellites provide SST data that is widely accessible on
the Internet for both the commercial and recreational angler.
Knowing the SST is useful for several reasons: First of all, each species of offshore game fish has a water temperature range that they prefer. Second, changes in water temperature are a very good indicator of horizontal and vertical water movement, i.e., eddies, breaks, currents, rips, upwellings, etc. Fishermen constantly look for these conditions using satellite data because most of the time they are such large circulation features that they are difficult to see with the naked eye. The bottom line is that moving water carries nutrients, which fosters plankton growth, which attracts fish.
Temperature breaks are defined boundaries between areas of two different water temperatures. This indicates horizontal water movement, and the important aspect is that the area defined by the break is usually a space between different currents moving at different speeds, resulting in the formation of rips or slack water between the two currents. This slack region of calm water tends to collect nutrients, which fosters plankton growth, which attracts fish.
Vertical water movement or upwelling brings nutrient rich water from the deep ocean to the surface. Eddies are whirlpool-like swirls of water spun off from the main body of a larger current. The swirling motion of eddies cause nutrients that are normally found in colder, deeper waters to come to the surface. The nutrient rich water fosters plankton growth, which, once again, attracts fish.
NESDIS
Sea Surface Temps
NOAA
CoastWatch Ocean Product Server
Monthly
Average Sea Surface Temperature Maps
NOAA
Environmental Technology Laboratory
HotSpots
Charts
Rosenstiel
School
Sputnik Server - NOAA satellite SST data for the Eastern Hemisphere.
Related Links:
NASA's
Visible Earth
Ocean
Surface Topography from Space
Moderate Resolution Imaging Spectroradiometer (MODIS) - MODIS is the key sensor aboard the Terra (EOS AM-1) satellite. Terra MODIS is viewing the entire Earth's surface every to 2 days, acquiring data in 36 spectral bands.
Ocean
Color and Temperature Scanner - OCTS
![]()
 Navigation
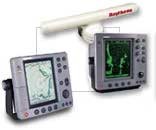
More
and more commercial
fishing fleets and recreational fisherman use satellites to navigate to optimum fishing locations and to
track fish migrations. Access to fast and accurate navigational information
saves time and fuel through more efficient determination of destination.
U.S.
Coast Guard Navigation Center
ESA
- Satellite Navigation Applications
GLONASS
GARMIN
SI-TEX
- GPS
Chart Plotters, Sounders, and Fish Finders
![]()
 Weather
Conditions
Weather
Conditions
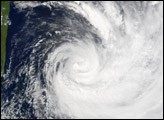
Fisherman
are affected by weather every time they go fishing. Aside from the personal comfort issues of fishing in
rainy and cold conditions, questions surrounding storms at sea can be a matter
of life and death. A smart
fisherman keeps a close eye on the weather and uses all the resources available
to stay updated on the conditions. Weather data gathered from various satellites
is ubiquitous and available to everyone on the Internet.
Weather conditions can also affect the actual fishing activities. Wave height and wind speed are factors that affect the amount of a fisherman's catch. A breeze that ripples the sea surface can have a significant effect on the success of a fishing trip. Gentler winds allow light to penetrate the water, which causes light-sensitive fish, usually found near the surface, to go deeper. Cloudy conditions can have similar effects. Clouds are thought to cause light-sensitive fish to be more active. In general, sudden changes in weather conditions, such as those associated with the passage of a cold front, are not good for fishing because these changes disturb the environment considerably.
NOAA
National Weather Service (NWS), GOES imagery
GMS
Space
Science & Engineering Center-University of Wisconsin
Related Links:
NASA's
Visible Earth
EUMETSAT
- Meteosat images
University of Illinois at Urbana-Champaign, Satellite Imagery
Geostationary
Operational Meteorological Satellite - GOMS
![]()
 Ocean
Color
Ocean
Color
Subtle
changes in ocean color signify various types and quantities of marine
phytoplankton (microscopic marine plants), the knowledge of which has
applications for both scientists and fisherman alike.
Phytoplankton
are single-celled ocean plants that contain chlorophyll. Increases in
phytoplankton cause higher levels of the green chlorophyll pigment, which in
turn change the color of the ocean surface. Although microscopic, phytoplankton
can bloom in such large numbers that they can change the color of the ocean so
much that they can be measured from satellites. (http://www.gsfc.nasa.gov)
By
looking at the color of an area of the ocean, the concentration of phytoplankton
can be estimated. Because phytoplankton changes an ocean's color, they are ideal
candidates for tracking eddies and currents, detecting pollution, and observing
meteorological events.
(http://www.gsfc.nasa.gov)
USJGOFS - Satellite Observations of Ocean Color - Satellite observations of ocean color.
University of Miami - 14 day rolling archive of Miami level-2 MODIS data from the Rosenstiel School of Marine and Atmospheric Science.
Sea-viewing
Wide Field-of-view Senor (SEAWIFS)
SeaWiFS
Images - NASA's Visible Earth
Related Links:
Ocean
Color and Temperature Scanner - OCTS
Medium
Resolution Imaging Spectrometer - MERIS
Modular
Optoelectronic Scanner - MOS
TERRA
(EOS)
TERRA
Images - NASA's Visible Earth
AQUA
(EOS) - Flying
in an orbit that will cover the globe every 16 days, the Aqua mission
provides a multi-disciplinary study of the Earth's atmospheric, oceanic,
cryospheric, and land processes and their relationship to global change.
With six instruments aboard, the Aqua Satellite will travel in a polar,
sun-synchronous orbit.
Moderate
Resolution Imaging Spectroradiometer (MODIS)
- MODIS is the key sensor aboard the Terra (EOS AM-1) satellite. Terra MODIS
is viewing the entire Earth's surface every to 2 days, acquiring data in 36
spectral bands.
MODIS
Images - NASA's Visible Earth
ENVISAT
![]()
 Sea Floor Topography
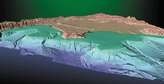
A
sudden rise in sea floor topography (banks, seamounts, etc.) can significantly
enhance the upwelling of cold, nutrient rich waters from the depths of the
ocean. This upwelling brings fertile water up to the surface, which can attract
small fish. The small fish, of course, act as bait for larger fish. These
larger fish, of course, attract fisherman.
NGCG
Topography/Bathymetry Maps
National
Geophysical Data Center (NGDC)
National Ocean Service (NOS) US Bathymetric & Fishing Maps - The National Geophysical Data Center is now the official distribution point for all the NOS bathymetric maps, bathymetric/fishing maps, regional maps, geophysical maps and preliminary maps.
IHO Data Center for Digital Bathymetry (IHO DCDB) - The worldwide digital data bank of oceanic soundings are maintained in several data bases, including the GEODAS global marine geophysical data base, and the Hydrographic Survey Data System.
NGDC Bathymetry, Topography, & Relief - NGDC collects public domain digital elevation models to develop a global digital elevation model.
![]()
Related Links Various Organizations and Agencies involved
with international remote sensing:
Various Organizations and Agencies involved
with international remote sensing:
|
Search Engines Tools to help you find your proverbial needle in the
Internet haystack:
Tools to help you find your proverbial needle in the
Internet haystack:
|
HOME | INTRO | SEA SURFACE TEMPERATURE | NAVIGATION | WEATHER | OCEAN COLOR | SEA FLOOR TOPOGRAPHY | LINKS | SALEM STATE