Chapter 12 Environmental Justice Alternative Policy I - Minority40 or Minority25 and Income150
This Environmental Justice Alternative Policy I option uses a threshold of 40% or higher for the minority criterion and separately adds an income-modified minority criterion. For the latter, block groups qualify for environmental justice status if they are 25% or greater minority and the median income of the block group does not exceed 150% of the statewide median (i.e. $111,250.50).
Under this Environmental Justice Alternative Policy I policy alternative, environmental justice communities are defined as neighborhoods (U.S. Census Bureau census block groups) that meet one or more of the following criteria:
- The median annual household income is at or below 65 percent of the statewide median income for Massachusetts; or
- 40 percent or more of the residents are minority; or
- 25 percent or more of the residents are minority AND the median annual household income does not exceed 150 percent of the statewide median income for Massachusetts; or
- 25 percent or more of the residents are lacking English language proficiency
Compared to the benchmark 2010 environmental justice community criteria, the minority- and income-modified criteria of this alternative policy reduces the number of block groups qualifying as an environmental justice community by 180, from 2192 to 2012 in total. Under this Environmental Justice Environmental Justice Alternative Policy I alternative policy, 40.5% of Massachusetts block groups are classified as environmental justice communities. This classification can be visualized in Figure 12.1 below, which shows the percentage of block groups that fall into each category or combination of environmental justice criteria.
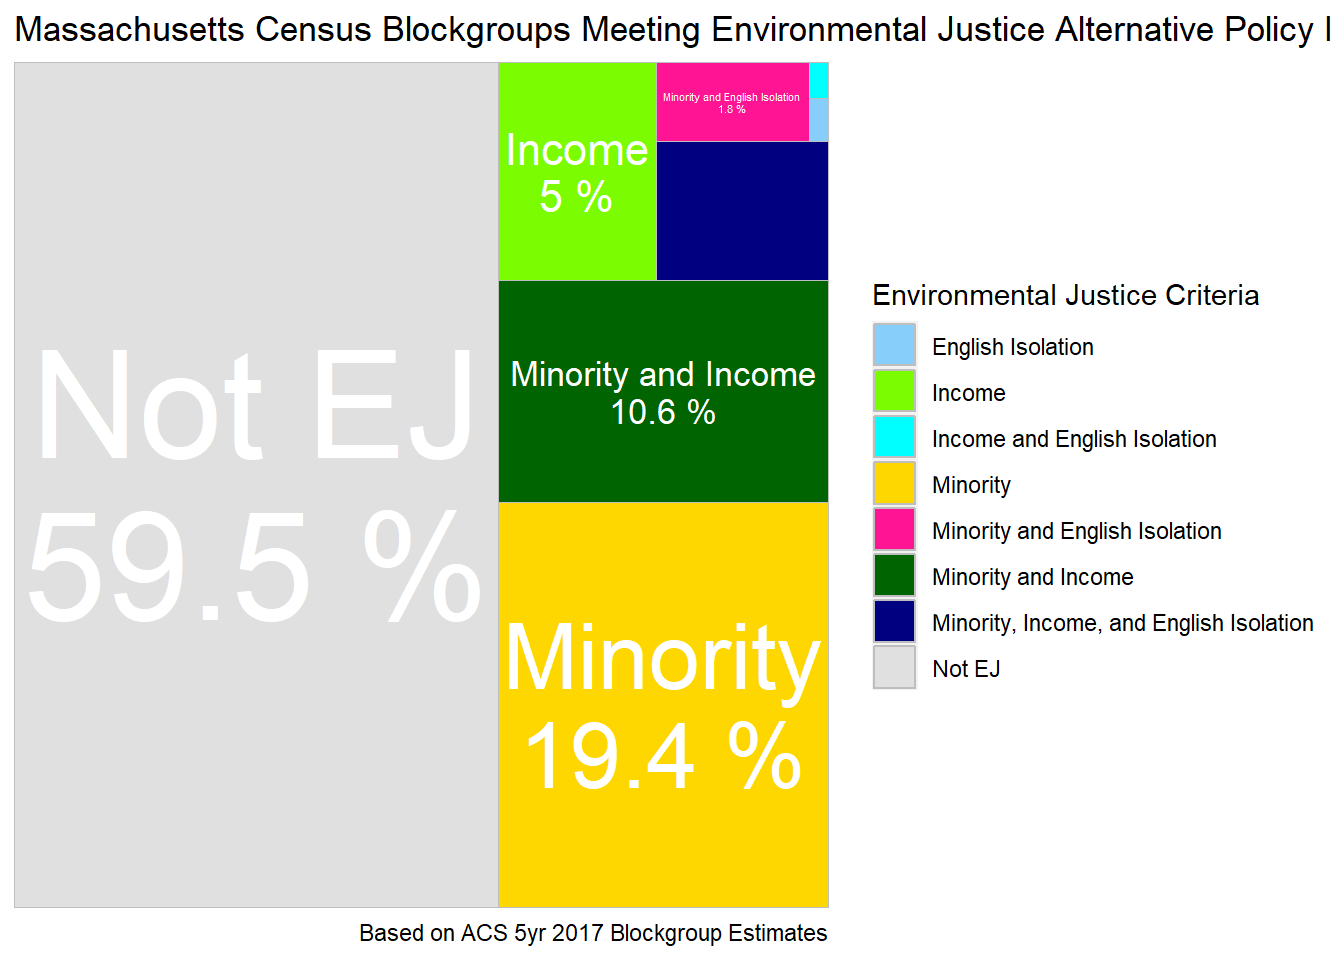
Figure 12.1: Tree map of block groups classified as environmental justice by Environmental Justice Alternative Policy I - Minority40 or Minority25 and Income150.
These classifications can be visualized and explored geographically in the interactive map below. Click on the search tool (white box in upper left of map) and type in a town or city name to zoom to that municipality. Click on individual block groups to see more detailed demographics. Click on the layer button (white box in the upper right of the map) and activate the Lost EJ Policy I layer in the map to see the block groups that are delisted (i.e. “Lost”) as environmental justice communities under Poliicy Environmental Justice Alternative Policy I, shown as light red or salmon colored polygons.
Figure 12.2: Map of block groups classified as environmental justice by Environmental Justice Alternative Policy I.
Another way to evaluate the impact of Environmental Justice Alternative Policy I is to look at how many “lost” environmental justice classifications occur within wealthier municipalities. Under Environmental Justice Alternative Policy I, 88 (48.9%) of the 180 lost environmental justice classifications occur in these highest income municipalities. Conversely, 87 (4.3%) of environmental justice block groups remain within these highest income municipalities. The latter addresses the issue of environmental justice designations that occur in communities not typically associated with environmental injustices. Activate the Top 20% Median Household Income layer in the map to see the municipalities in the top fifth of median household incomes (i.e. median household incomes ranging from $105,169 to $204,018), which are shaded in blue.