Chapter 3 Environmental Justice Policy 2017
In 2014, then Massachusetts Governor Deval Patrick issued an Executive Order of Environmental Justice which required EEA to update its original Environmental Justice Policy within 60 days of the order. Two years later, EEA finally released an updated Environmental Justice Policy. The 2017 Environmental Justice Policy continued with the three de facto demographic criteria for defining environmental justice communities. Specifically, the 2017 policy defined environmental justice communities as
neighborhoods (U.S. Census Bureau census block group data for minority criteria, and American Community Survey (ACS) data for state median income and English isolation criteria) that meet one or more of the following criteria:
- 25 percent of households within the census block group have a median annual household income at or below 65 percent of the statewide median income for Massachusetts; or
- 25 percent or more of the residents are minority; or
- 25 percent or more of the residents have English Isolation
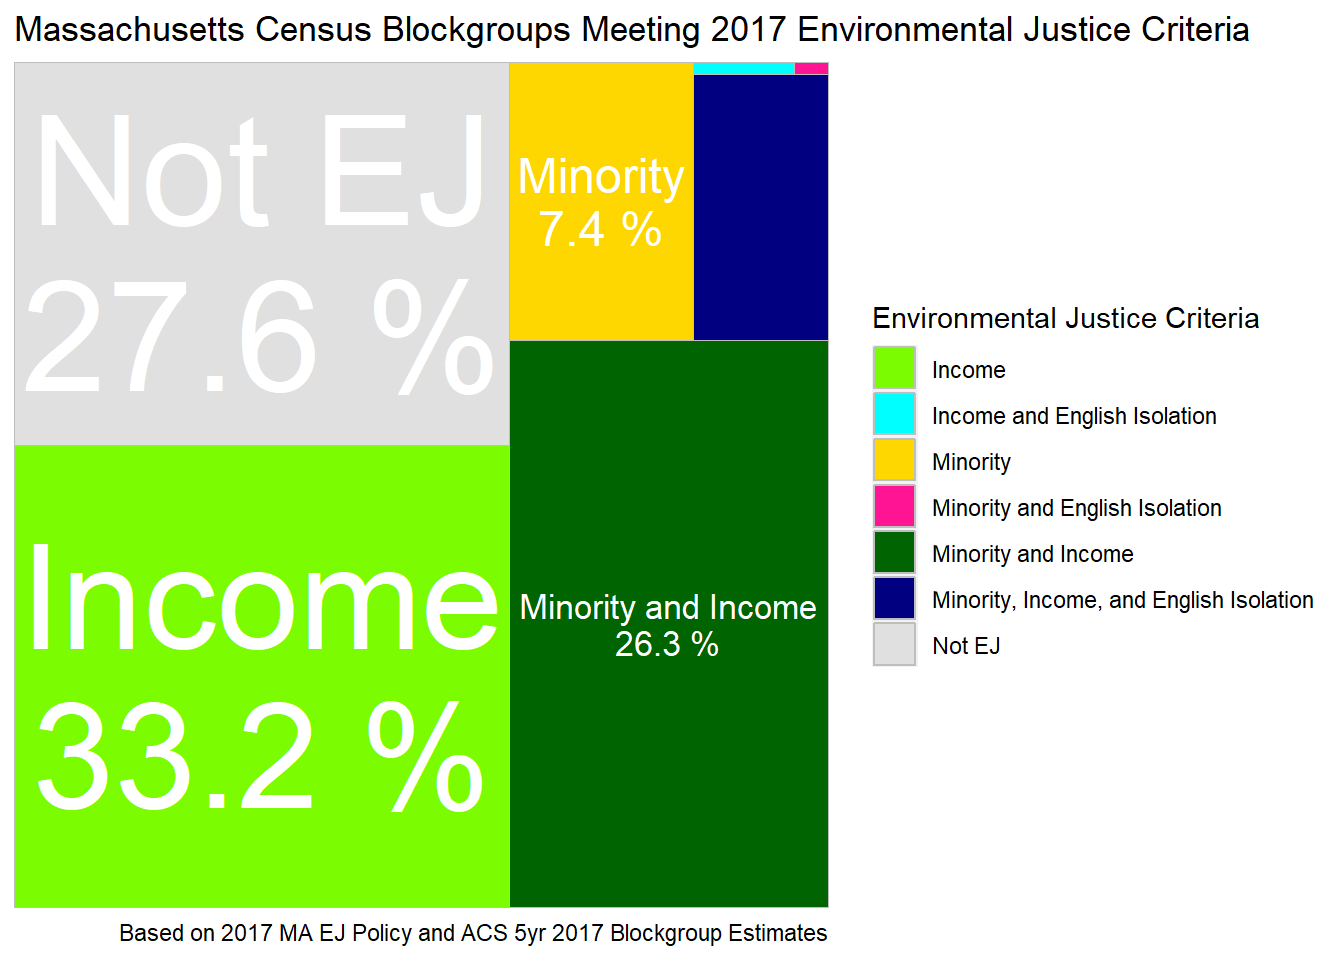
Curiously, the 2017 policy redefined how income is measured. Where the previous policy identified the income criterion based on the median income of the block group, the 2017 policy based it on the percentage of households within the block group with incomes at or below 65% of the statewide median. This change in measurement has significant implications. The most obvious impact is that it dramatically increases the number of block groups that qualify as environmental justice communities under the Income criterion. Using this definition and the American Community Survey 5-year Estimates for 2013-2017 for block groups in Massachusetts, we find that the percentage of Massachusetts block groups classified as environmental justice communities jumps from 44% under the previous policy to 72% under the 2017 policy. In other words, nearly three-fourths of the state becomes an environmental justice community. Most of this growth is a result of the redefined Income criterion. This classification can be visualized in Figure 3.1 below, which shows the relative proportion of block groups that fall into each category or combination of environmental justice criteria. Notice that the Income criterion now becomes the dominant environmental justice community criterion. On a more technical level, the choice to measure income based on the number or percentage of households below the income threshold also reduces the precision of the measurement. This is because the ACS reports the number of households by income in wide ranges that do not necessarily coincide with the desired threshold. For example, the environmental justice Income criterion is 65% of the statewide median household income, which for the ACS 5-year 2017 period would be $48,208. The closest income range reported by the ACS is $45,000 to $49,999. It is therefore not possible to report the number or percentage of households meeting a particular median household income with any greater precision.

Figure 3.1: Tree map of block groups classified as environmental justice by 2017 policy.
These classifications can be visualized and explored geographically in the interactive map below. Click on the search tool and type in a town or city name to zoom to that municipality. Click on individual block groups to see more detailed demographics. Note how the Income criterion for the 2017 EJ policy captures nearly all of western Massachusetts. Certainly, it reveals a significant difference in income between western and eastern Massachusetts, but it is not clear if this was the intended outcome for environmental justice designations.