| Remote Sensing for Wind Power Generation | ||
| INTRODUCTION Siting Wind Turbines Remote Sensing OVER SEA OVER LAND ON SITE WIND POWER
Web site created
by E-mail comments and suggestions to pmkelly@prodigy.net. Last updated 4/24/2002.
|
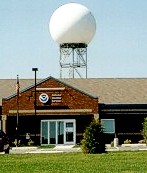 NexRAD
Doppler Radar tower NexRAD
Doppler Radar towerNational Weather Service, NOAA OVER LAND Doppler Radar NexRAD radars can operate in two modes: clear air mode and precipitation mode. Clear air mode is slower and more sensitive, picking up the movement of dust, light snow, and other suspended particles. It takes about ten minutes to scan from 0.5° to 4.5° above the horizon. Precipitation mode is faster, taking five to six minutes to scan from 0.5° to 19.5°. The higher elevation angle allows better understanding of the vertical wind profile in storm conditions. The movement of wind toward or away from the radar—called radial velocity—does not yet give us wind speed and direction. Determining wind movement in two or three dimensions is an ongoing challenge. One approach is to compare radial velocities from two (or more) separately located radars scanning overlapping areas. Radars are expensive, however, and the network is not dense enough to allow this solution generally. Another approach is radar interferometry, in which multiple receivers are located separately, all receiving backscatter from the same transmitter. Since receivers are much less expensive than transmitters, this approach may prove more feasible economically. Finally, work continues on algorithms that can extract two or three-dimensional wind fields from radial velocities as detected by a single Doppler radar. U.S. Geographic Coverage
A detailed discussion of the operation and output of WSR-88D radars (in a lab for a Texas A&M meteorology course) includes a discussion of velocity products. It is pointed out that reliable velocity data, especially in clear air, extend over only 80 nautical miles, about two thirds the radius of standard precipitation products. It is not yet clear to how much Doppler radar data is being used in the development of newer wind atlases. Research Programs The University of Essex’s Doppler Wind Retrieval Project focuses on two general areas: the possibility of running convential and Doppler measurements at the same time (despite different sampling requirements) and presentation of Doppler data, to experts and non-experts. They are particularly concerned with VADs (velocity azimuth diagrams) and fitting wind models to them. Images of VADs and PPIs (plan position indicators) may be viewed on their site. University of Nebraska-Lincoln’s Environmental Remote Sensing Laboratory (ERSL) has several atmospheric Doppler radar projects. These investigate methods of wind profiling throughout the lower 3 km of the atmosphere, spatial interferometry (which employs an array of receivers), and imaging techniques for clear air turbulence, including animations of vertical and horizontal slices of clear air turbulence. |
 Examination
of precipitation
Examination
of precipitation