| Remote Sensing for Wind Power Generation | ||
| INTRODUCTION Siting Wind Turbines Remote Sensing OVER SEA OVER LAND ON SITE WIND POWER
Web site created
by E-mail comments and suggestions to pmkelly@prodigy.net. Last updated 4/24/2002. |
WIND POWER Growth in Wind Power [The Energy Efficiency and Renewable Energy Network (U.S. DOE) has a good introduction to wind power potential. The bar graph above shows the rapid growth of wind power in the '90s, especially in Europe. According to the Energy Research Center of the Netherlands, "During the last 25 years wind energy technology has developed spectacularly. The world-wide annual installation rate has increased in twenty years from a few megawatts to almost 4,000 MW. Commercial machines have grown in size from 10 kW (5 meter rotor diameter) to 2,000 kW (70 meter diameter).... The installed capacity in the world is over 15,000 MW." The U.S. Department of Energy has created the Wind Energy Program, with a policy goal to achieve an installed capacity of 10,000 MW by 2010 and derive 5 percent of electrical capacity from wind by 2020. The United States has abundant wind resources, especially along the east coast, the Appalachian Mountain chain, the Great Plains, and the Pacific Northwest. A 1993 study, Wind Energy Potential in the United States, estimated that the U.S. had at least enough wind to generate one and a half times the total national 1990 electric consumption. Like hydropower, wind power offers the benefits of zero emissions. Unlike hydropower, it does not require the flooding of river valleys, relying instead on unchanneled natural airflows. Disadvantages of wind power are that it is visible (turbine towers keep getting taller) and it is intermittent, delivering varying amounts of power—or no power—depending upon the wind. Wind power is also geographically specific: while North Dakota may have the potential to generate 36 percent of the national electrical demand, it is not feasible to transmit that power across the continent. Nevertheless, increased concern about global warming, pollution, and oil imports, combined with the development of more efficient wind turbines, have made wind power attractive politically and economically. Finding
Strong Winds Wind Atlases
Methods of producing wind atlases are complex, drawing on a variety of data sources. A lead developer of wind assessments in the U.S. has been a team led by Dennis Elliott at the National Renewable Energy Laboratory in Golden, CO, and the Pacific Northwest National Laboratory. The NREL team produced the Wind Energy Resource Atlas of the United States in 1986, based upon regional wind assessments done across the U.S. in 1979-80. While a model regional assessment was conducted in order to guide the contractors performing the regional assessments, they were given substantial leeway to gather available, relevant data. Nationally, 70 percent of the surface data came from National Climatic Data Center weather stations, but this percentage varied significantly by region. Weather data was also gathered from ships, utilities, the Forest Service, Canadian sources and university research projects. Qualitative information on topography and vegetation, especially wind-flagged trees, was also included in areas where data was sparse. Upper air wind data was often used to estimate winds in mountainous areas. Different estimates of the vertical wind profile were developed for lower latitude and upper latitude areas and all data adjusted to standard 10 and 50 m heights. Data for the regional assessments was screened and augmented for the national atlas. Since the certainty of accurate classification varies depending upon the quality and quantity of data, and the topography, a certainty value is assigned to each cell. A succinct summary of methodology for the 1986 atlas can be found at http://www.nrel.gov/gis/il_wind.html. For a detailed presentation, see Appendix A of the atlas. A current project looks to incorporate remotely sensed data. The Solar and Wind Energy Resource Assessment (SWERA), funded through the World Bank, will do wind assessments for 13 developing countries. The scope of work calls for the use of satellite scatterometer data for coastal and island areas. Five to seven regions will be mapped using a "1 km empirical/analytical mapping method, a 5 km Regional Circulation Model, or a modeled interpolation of gound data." NREL, one of the principal cooperating partners, is charged with producing 1 km wind gridded data with wind speeds within 10% accuracy and power densities within 20% accuracy at 80% of locations. A key part of the SWERA project is training agencies in developing countries in the use of WAsP (Wind Atlas Analysis and Application Program), a widely used wind modeling program for wind energy siting. Another recent project is the Wind Energy Resource Atlas of South Asia (WERASA), also conducted under the auspices of the World Bank. This atlas, covering Cambodia, Loas, Thailand, and Vietnam, was created using a recently developed application, MesoMap, that uses a mesoscale weather model to simulate wind data for sample days in 1984 through 1998. The input data are elevation, land cover, and vegetative greenness, as well as meteorological data, including gridded reanalysis weather data, rawinsonde data, and sea surface temperature measurements. Testing of MesoMap in other parts of the world have indicated a 4% accuracy in mean wind speed (within one standard error). Testing the model results in South Asia is difficult because of the paucity of historical weather data, but limited testing suggests an 8% accuracy. From the perspective of remote sensing, this wind model approach is interesting because many of the inputs may be derived remotely, including elevation, land cover, vegetative greenness, and sea surface temperature. I have not yet been able to determine the actual data sources for the South Asia atlas.
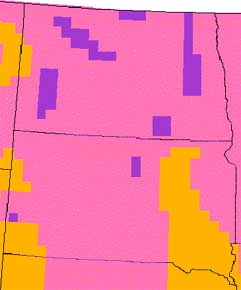
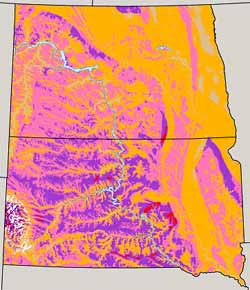
From 1986 U.S. wind atlas 2000 Wind Map of Dakotas Across the U.S., MesoMap and similar tools based upon sophisticated weather models are being applied to produce more detailed and accurate maps than the 1986 WERA-US. New York State is involved in an updated wind mapping project. For the Northwest, currently available maps may be viewed through Wind Power Maps. The old vs. new comparison above is taken from Northwest SEED, which is coordinating a project to produce new maps in the region using MesoMap. Other developed nations have produced wind atlases, such as Canada and Denmark. Renewables for Sustainable Village Power (another NREL site) provides links to wind assessements in China, the Dominican Republic, Mexico, Mongolia and the Phillipines, as well as WERASA countries. Site Studies To catch stronger winds with larger blades, the height of wind turbines has been increasing. Necessarily, so has the height of anemometer masts. As the cost of erecting a mast increases exponentially with height, there has been incentive to develop alternative methods to measure on-site winds. Studies in the last several years have reported promising experiments using mini-SODAR (SOund Doppler Acoustic Radar). Even if the choice is still made to erect a mast, sophisticated wind measurements may be obtained with an ultrasonic anemometer, such as is marketed by mini-SODAR maker AeroVironment. This small remote sensor will determine wind speed and direction in three dimensions and multiple measures of air turbulence. |